Scientific datasets are riddled with copy-paste errors
Initial results from scanning through Excel files belonging to 600 published scientific papers.

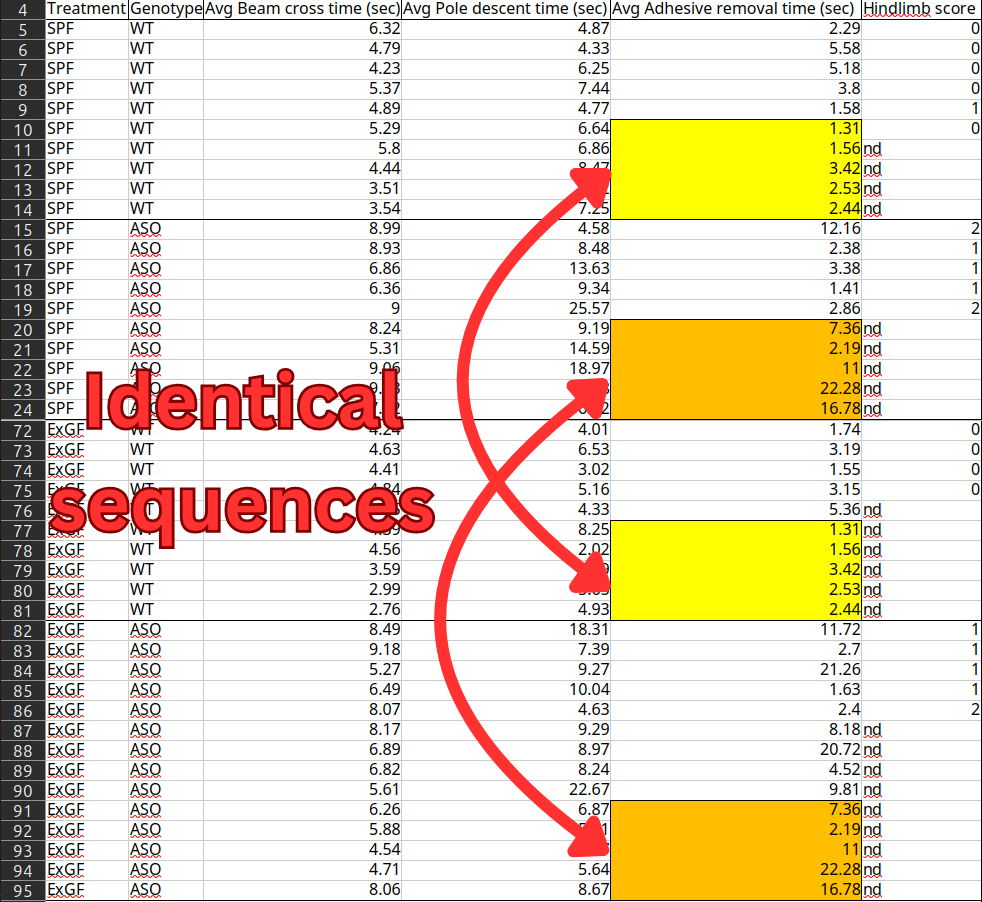
The above data comes from a landmark paper in Parkinson's Disease research, which provided the first-ever evidence that the disease originates in the gut rather than the brain. The paper received media coverage from major outlets and has amassed over 3000 citations from other scientific papers. But the underlying data contains sequences of duplicated values that should belong to completely different individual mice. The dataset has been publicly available on Dryad - an open-access repository where scientists upload their raw data - for more than 8 years. Why didn't anyone notice the blatant copy-paste errors until now?
Before going into more detail about this case, let me give some background on how we detected the issue: It was flagged by a piece of software I started building last year, which was inspired by two cases of data fabrication that made the news in recent years. One by Nobel laureate Thomas Südhof's lab and one by spider ecologist Jonathan Pruitt. Both cases had publicly available datasets with entire blocks of copy-pasted data that seemed quite trivial to detect. I was curious what I could dig up by creating a program that would correctly flag those cases, and then unleash it on all datasets available in open-access repositories.
Together with a few volunteer contributors, we've finished reporting all cases from the first 600 datasets we've scanned. There were 18 cases we felt were serious enough to report. Here are 3 of the most exciting ones:
Case 1: A seminal Parkinson's paper
- Article: Gut Microbiota Regulate Motor Deficits and Neuroinflammation in a Model of Parkinson’s Disease Cell (2016)
- Dryad dataset | Pubpeer comment
We took mice that were genetically predisposed to developing symptoms of Parkinson's and we just cleared out their microbiome - all their symptoms went away.
That's how the paper's senior author Sarkis Mazmanian summarized the findings of the study when he went on the Rich Roll Youtube channel:
These are the results he is referring to:

Graphs B, C, and D contain measurements of the motor function of different groups of mice. They tell a clean story where the ASO mice (genetically predisposed to developing the mouse model Parkinson's disease) take longer to complete the tasks than regular wild-type (WT) mice only when they have retained a normal gut microbiome (SPF, Ex-GF) - not in mice stripped of their microbiome (GF, Abx).

There are two issues with the data:
- There are two sets of 5 identical sequential numbers in the "Adhesive removal times" column, shared between the SPF mice (brought up with a normal, healthy microbiome) and the ExGF mice (raised with a stripped microbiome, but then had their gut re-colonized).
- There's a pair of sequences of 3 identical numbers within "Pole-descent time" data for the germ-free wild-type mice.
Verdict
It could be either a fat-finger mistake when editing the Excel file or deliberate tampering to cover up real data that didn't tell the right story.
The study has low sample size, so the impact on the conclusions of the paper is serious, even if we trust the rest of the data. The duplicated rows make up 50% of the SPF samples and 42% of the ExGF samples. While the motor function values are not the only data the authors rely on for their conclusions, they're necessary for showing that the gut bacteria actually caused Parkinson's-like symptoms.
The issue was reported in January, and the authors have so far not responded.
Case 2: Ostrich-snake mixup
- Article: Constraints on the evolution of toxin-resistant Na,K-ATPases have limited dependence on sequence divergence PLOS Genetics (2022)
- Dryad dataset | Pubpeer comment
In this paper, the authors investigated how different animals have evolved resistance to a family of toxins called cardiotonic steroids (CTS). There's an arms race in nature where prey species produce CTS to protect themselves against animals such as birds and snakes, who in turn have developed mutations to help protect themselves against the toxin.
The authors created a blend of Ouabain (a CTS) and Na,K-ATPase (the protein that the poison targets) to get a dose-response curve showing how well different versions of the protein survived the poison at various doses.
Issues

The yellow cells are precise duplicates between the Ostrich/Sandgrouse data and the Xenodon data (a species of snake). More damning are the orange cells, which are near-duplicates that differ by one or two digits, always ending with the same digit. For example, 0.538 on row 39 becomes 0.518 on row 71.
In her response, the lead author Shabnam Mohammadi concedes that this probably is a copy-paste error. For the suspicious orange cells she gives the following explanation:
We suspect that they [the cells with one-digit tweaks marked in orange] stem from measurement variation among multiple reads of the same plate, and that the Ostrich and Xenodon results were copied from different readings of the same plate. However, since the original reader outputs are not available, we cannot confirm that this is the source of the variation.
Verdict
Could the one-digit tweaks be caused by multiple readings of the same plate as the author theorizes? My best guess is no. When doing a couple of readings in a row of the same plate we would generally expect many of the values to jump around a tiny bit. Instead we see almost all of the values staying the exact same except 8 that change by a lot.
I first theorized that the tweaked numbers always ending on the same digit could be caused by some de-noising algorithm in the microplate reader. But I don't think the BioRad model 680 does any processing that could explain the pattern. It's a basic machine that records raw light measurements as it sees them.
And to state the obvious: the chance that we would see 6 values in a row that happen to end with the same digit is 1 in 10⁶. Even after adjusting for multiple comparisons, it would be supremely unlucky for the authors if this happened by chance.
The alternative explanation is that the authors either accidentally or deliberately copy-pasted the Ostrich/Sandgrouse data on top of the Xenodon data. Then they manually tampered with the data to make it better suit their hypothesis or make it look less suspicious, not realizing that the copy-and-paste would leave behind this signature. However, the fraud theory suffers from there not being any obvious reason for why the authors would tamper with these specific values.
Case 3: Scrambled fish sizes
- Article: Behavioural individuality in clonal fish arises despite near-identical rearing conditions Nature communications (2017)
- Dryad dataset | Pubpeer comment
Background
This is a paper from 2017 about fish personalities. They took a bunch of genetically identical fish, then checked how much their swimming behavior varied in terms of distance traveled. The idea was to see how much their behavior differed while keeping genetics and environment identical. Besides movement, they also took the size of each fish into account to check that any difference in movement was not just a result of bigger fish moving differently from smaller fish.
Issues
The SL column is the length of the individual fish measured in millimeters. Can you spot anything that looks out of place?


It looks quite strange that 3 different individual fish (ID 5, 8 and 10) all have the exact same sequential size measurements. But wait, can an individual fish really get >10% shorter over the course of a few days? Did they actually measure the length of every individual fish 4 times? No.
Verdict
The real explanation becomes obvious if we order the sheet by the SL column. It reveals that every unique SL value reoccurs exactly four times. 4 also happens to be the number of observations that were done per individual fish.

The reason for that is that the authors only measured the length of a fish once. So all 4 rows with observations of the same fish are supposed to have the same exact fish length, but they have been scrambled so that the length of one fish has been given to 4 other fish.
In his response, the first author admits to the error and gives the following explanation:
[I]n short, we stored measured body size and behavior in two separate data files and when we joined these files, we accidentally misaligned the ID values resulting in a phase shift where all body size values were shifted and assigned to the wrong rows
And I don't see any reason to doubt him.
In the paper they unsurprisingly concluded that body size didn't have any effect on distance traveled, while in their corrected analysis they do find a small effect:
Body size now is a significant predictor of behavior but its effects are quite small (i.e. a 1mm increase in body leads to a 0.8cm decrease in total distance swam over the whole trial) and in fact roughly 3x smaller than the effect of observation. More importantly though, body size still does not explain the among-individual variation in behavior.
It looks like the authors did a solid job of owning up to their mistake and correcting the dataset. Luckily, body size turned out to only explain a small part of the behavioral differences between the fish. "The conclusions remain unaffected" is one thing you should never take at face value coming from a researcher, but in this case it appears to be right.
Overall results so far
The software detected 18 cases in the first 600 datasets that were serious enough to report (see the full list here). Most of them probably innocent mistakes, some may be deliberate fabrication. One of them had already been retracted. So based on that limited sample, around 3% of papers contain these types of errors.
However, the true error rate must surely be a lot higher than 3%. There are myriad other ways of accidentally screwing up your data that this software could never detect. And if you want to commit fraud, there are plenty of less lazy ways to do it than to copy-paste values from a different part of the same Excel sheet.
It might come as a surprise to some that nobody else has cared to check for these errors. Isn't there some peer review thing that is supposed to prevent stuff like this from making it into the scientific record? The conclusion I've come to is that there just isn't anybody whose job it is to actively look for it. Journals, universities and funding organizations won't hire anyone to do it because they generally care a lot more about rankings and metrics. And if you report a serious error to them you've just introduced an annoying inconvenience that might make those numbers go in the wrong direction.
The only bright spot has been Dryad - the research data repository. They have taken an active role in supporting the project by helping push journals and authors to correct the record.
What's next
I started working on the project last year, and after some good initial results, I was able to raise a 50,000$ grant from Astral Codex Ten (a popular science blog), which allowed me to quit my job and start working on it full-time this year. Next up is to scan through the rest of the ~24,000 datasets with Excel files available on Dryad. It will be interesting to see what other treasures we can dig up there! If the 3% error rate holds, we'd expect to see ~700 more cases in that sample alone. Feel free to subscribe to the email newsletter to stay up to date on what we find.